Debugging
Break on your flow's nodes and step through your script code from the Flow Builder extension — against real runs on a development environment, not a simulation.
Two Debuggers
Debug a deployed project the way you debug any application.
KeenAgents ships two debuggers, and you drive both from the Flow Builder extension in your IDE — for example, VS Code. One is for the flow graph (breakpoints on nodes) and one is for your script code (ordinary line breakpoints). During development you deploy your project to a development environment, set breakpoints, and run a conversation; when the run reaches a breakpoint it pauses and control passes to your IDE.
This is a real debugger over real runs, not a replay or a simulator: the values you see are the actual data flowing through the conversation at that moment. The flow debugger stops on the nodes you mark; the script debugger steps through your JavaScript line by line. Together they turn "the answer came out wrong" into a breakpoint you can stop on and read.
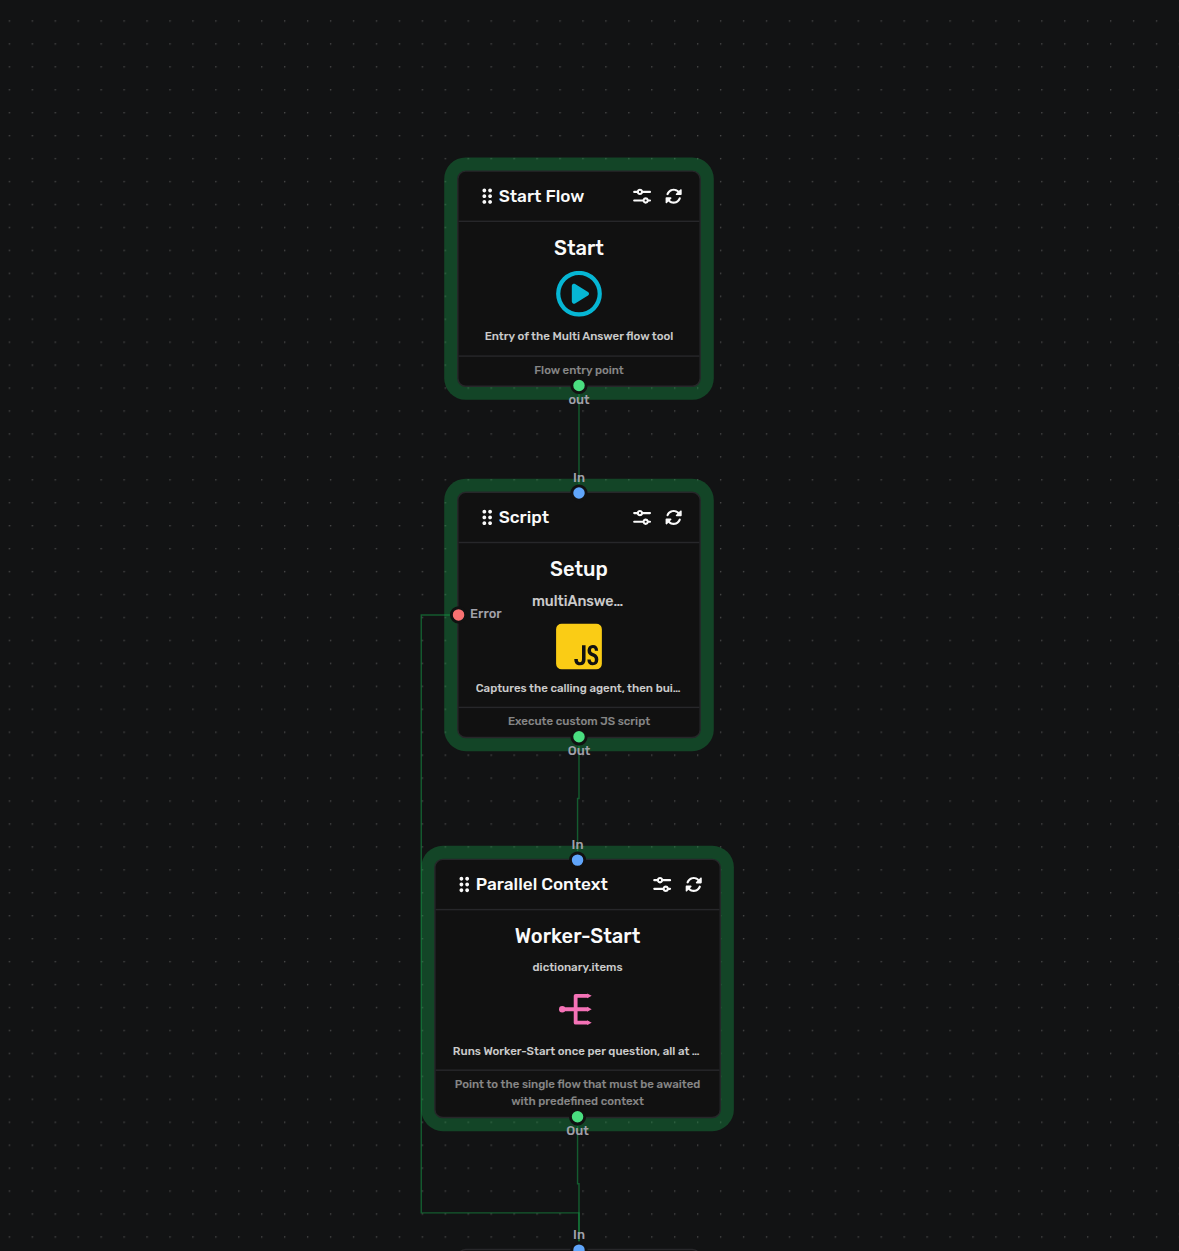
A node marked with a breakpoint — the run pauses here when it's about to execute.
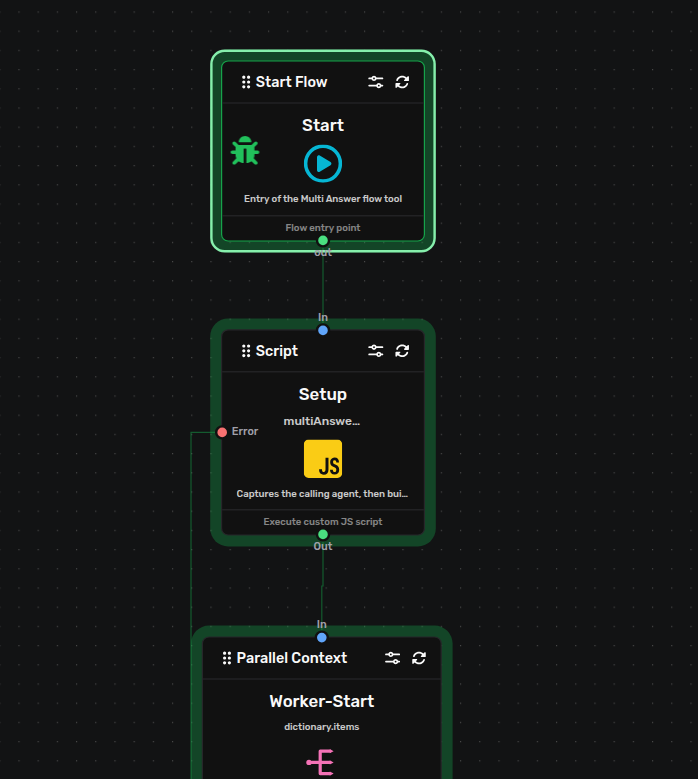
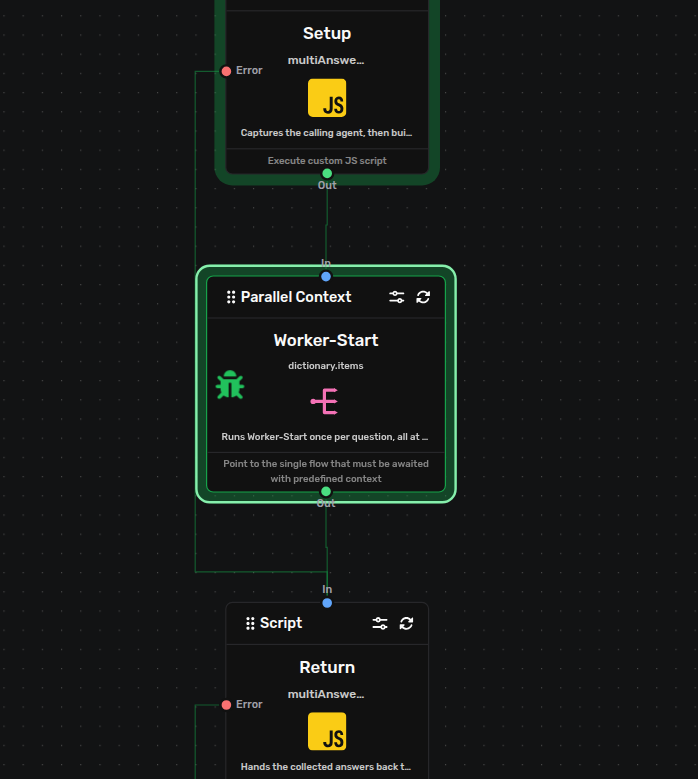
The flow debugger paused: the active node glows as the run stops on it — hit continue to step to the next marked node.
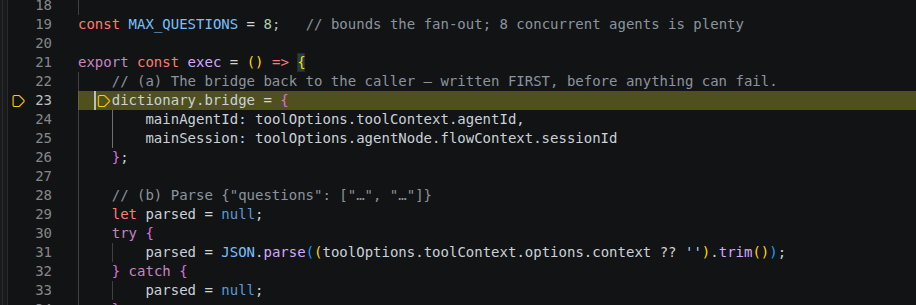
The script debugger: ordinary line breakpoints, stepping through your own script code line by line.
Everything Is Debuggable
Not just scripts — the whole flow, including agent nodes.
Breakpoints cover the whole flow, even though each node runs in its own isolated sandbox — there are two debuggers, one for the node graph and one for your code:
- Flow node logic
- The flow debugger. Mark any node, and the run pauses when that node is about to execute — a condition, a loop, a join, the fan-out of parallel work — so you can read the working memory and session the flow is deciding on before it branches. Its unit is the node: continuing runs to the next marked node rather than stepping line by line.
- Script code
- The script debugger. Set ordinary line breakpoints inside your own script-node code, step through it line by line, and inspect its variables — the same experience as debugging any JavaScript, mapped to your original source.
- Agent nodes
- Agent nodes are nodes too, so the flow debugger can pause on one — stopping the run right where the model is about to be called, so you can read the working memory and session feeding it. Being able to break on the whole graph, agent nodes included, is what makes debugging a full conversation possible rather than only the parts that stay in one place.
What You Can Inspect
The live state a paused run exposes.
- The conversation's working memory — the data flow nodes read and write as the graph runs — at the node the run is paused on.
- The session shared across the run, and the values passing from one node into the next.
- At an agent node, the working memory and session feeding the model at the moment the run pauses there.
- Local variables inside your script code, with full step-in / step-over / continue control from your IDE.
Using It
The shape of a debugging session.
- Deploy your project to a development environment, then start the matching debugger — the flow debugger or the script debugger — from the Flow Builder extension.
- Set breakpoints where you want to stop — mark a node in the flow (including an agent node), or a line in your script code.
- Run a conversation against the agent. When execution reaches a breakpoint the run pauses and control passes to your IDE.
- Inspect the working memory, session and node values, step through, and continue. The run resumes exactly where it paused.
Good to Know
- In the script debugger, breakpoints are mapped to your original source, so you stop on the code you wrote, not a transformed build of it. Flow breakpoints are kept by the extension — they are not written into your flow files.
- Each node still runs in its own sandbox while you debug, so a paused node cannot corrupt another conversation's data — but a development environment with breakpoints set is single-file: while one run sits paused in your IDE, other runs on that environment that reach a node the debugger watches wait until you continue. Debug alone on a development environment, never against shared traffic.
- Debugging shines on the problems that are otherwise hardest to see — a value that is subtly wrong several nodes deep, or an agent node fed the wrong context — because you can stop on the exact node and read the live state.
- Debugging is for development. To see what a flow did on a live run — the branch it took, an external call's result, why it reached its error path — rely on the log lines your scripts write, which the platform can stream and store for a running agent.
Keen Agents 2026
Documentation
Release 15