7. Debug
You already pasted the .vscode/launch.json snippet in section 3. It ships attach configs for two source-level debuggers, and you pick whichever one matches what you want to break on:
- Flow debugger (
:7101) — pause on a node, inspect the livedictionary/session, and step node-to-node. This is the one driven by the F9 node breakpoints below. - Script debugger (
:7100) — set an ordinary line breakpoint inside a Script Node's*.jsand break inside your own code mid-execution. See Script Node debugging for that flow.
Now use the Flow debugger to step through your flow.
By holding the left mouse button you can select all of the nodes on the flow canvas. Then by pressing F9, you add the selected nodes as debug points tracked by the Flow debugger — they turn green:
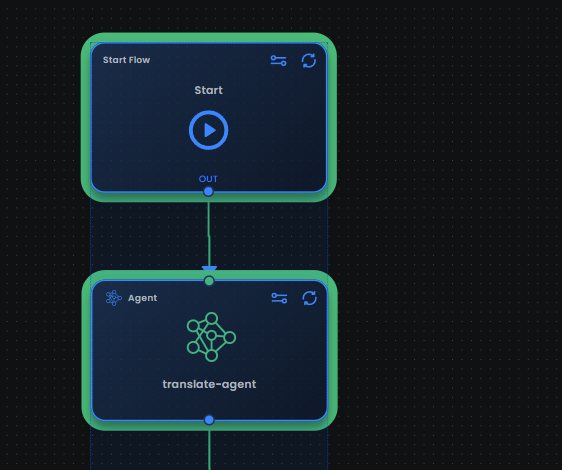
Press F5 to start the debugger.
Write a message in the chat UI to start a process in your flow and use the debugger.
Important! Always press Continue until you reach the end of the flow before you detach the debugger — this avoids errors.
Do not leave the debugger on if the flow is doing something for too long; you might get an error.